
Studies show that nearly 80 percent of women search for a menstrual cycle diagram to understand body changes better. A menstrual cycle stages diagram visually explains what hormones and organs do every month. Many women experience symptoms without knowing their cause. This guide explains the stages of the menstrual cycle diagram in simple language. You will also understand how a menstrual period diagram reflects real body changes during each phase.
Understanding The Menstrual Cycle Through Diagrams
A menstrual cycle diagram offers a clear picture of internal processes that cannot be seen otherwise. The menstrual cycle stages diagram shows how hormones rise and fall across the month. It also explains how the ovaries and uterus respond at each stage. Visual learning helps women connect symptoms with biological activity.
Diagrams simplify complex hormonal interactions. They show when the uterus sheds its lining. They also show when an egg matures and releases. For women tracking fertility or symptoms, diagrams provide clarity. Many healthcare professionals rely on diagrams for patient education.
Understanding diagrams builds confidence in cycle awareness. It helps women explain symptoms clearly to doctors. It also supports informed lifestyle planning. For a basic explanation of cycle structure, explore this detailed menstrual cycle overview guide on Menstrual Cycle.
You can also browse the menstrual health to strengthen foundational knowledge.
Stage 1 Menstruation In The Menstrual Cycle Diagram
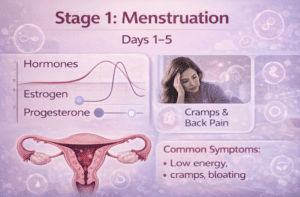
In a menstruation period diagram, the cycle begins with menstrual bleeding. This stage represents the shedding of the uterine lining. The lining was built in the previous cycle. Bleeding usually lasts between three to seven days.
In diagrams, this stage is shown with a thinning uterine lining. Estrogen and progesterone levels appear low. These hormones drop when pregnancy does not occur. This hormonal drop triggers uterine contractions. These contractions push the lining out of the body.
Physically, many women feel tired during this stage. Cramps, back pain, and bloating are common. Emotionally, sensitivity or low motivation may occur. Diagrams help explain why rest is important now. The body is completing a cleansing process.
Understanding this stage through diagrams reduces confusion. It helps women see menstruation as functional rather than problematic. For period comfort and hygiene practices, visit this period care and hygiene guide on Menstrual Cycle.
You may also explore insights from the women wellness category for supportive lifestyle tips.
Hormonal Activity Shown In Menstruation Diagrams
Hormone graphs in diagrams show estrogen and progesterone at their lowest. Prostaglandins appear elevated. These chemicals cause uterine muscle contractions. Strong contractions explain pain intensity in some women. Hormone levels begin rising slowly near the end of bleeding.
What Your Body Experiences During This Stage
Energy levels remain low for many women. The digestive system may feel slower. Sleep patterns may change slightly. Light movement supports circulation. Hydration helps manage fatigue.
Stage 2 Follicular Phase In The Stages Of The Menstrual Cycle Diagram
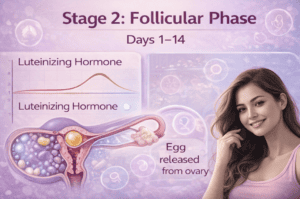
The follicular phase begins on the first day of menstruation. It continues until ovulation. In a stages of the menstrual cycle diagram, this phase shows follicles developing in the ovaries. Each follicle contains an immature egg.
Diagrams illustrate estrogen rising steadily during this stage. This hormone thickens the uterine lining. It prepares the uterus for a possible pregnancy. Only one follicle becomes dominant. That follicle matures fully.
Women often feel increased mental clarity during this stage. Motivation and focus improve gradually. Skin and digestion may also respond positively. Diagrams show this phase as a rebuilding period.
Understanding this stage helps women plan activities. It is a good time for starting new routines. Hormonal stability supports productivity. For hormonal balance support, explore this hormonal health resource on Menstrual Cycle.
You can also learn more from the cycle awareness category for deeper insights.
Follicle Development Explained Through Diagrams
Diagrams show multiple follicles forming initially. One follicle grows larger than others. Estrogen release increases from this dominant follicle. The uterine lining thickens gradually. The body prepares for ovulation.
Body Changes During The Follicular Stage
Energy levels begin rising steadily. Mood becomes more stable. Appetite normalises for many women. Exercise feels easier. This phase supports growth and planning.
Stage 3 Ovulation Explained Using A Menstrual Cycle Stages Diagram
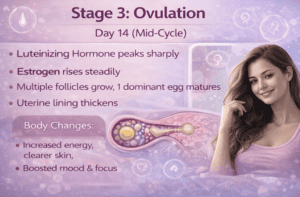
Ovulation is clearly highlighted in a menstrual cycle stages diagram. It appears mid cycle. A sharp rise in luteinising hormone triggers egg release. The egg leaves the ovary and enters the fallopian tube.
Diagrams show ovulation as a short event. The egg survives for about twenty four hours. Fertilisation can occur only during this window. Cervical mucus becomes clear and stretchy. This change supports sperm movement.
Many women feel confident and social during ovulation. Energy and communication improve. Diagrams help women identify this fertile window accurately. Understanding this stage supports family planning choices.
For practical fertility awareness, explore this ovulation tracking guide on Menstrual Cycle.
You can also review tools from the fertility education category for better cycle understanding.
Hormonal Surges Seen In Ovulation Diagrams
Luteinising hormone spikes sharply. Estrogen peaks just before ovulation. Progesterone begins rising afterward. This hormone shift triggers egg release. Diagrams make this timing clear.
Signs Your Body May Show During Ovulation
Clear cervical mucus is common. Mild pelvic sensations may occur. Libido often increases naturally. Focus and energy peak. These signs help identify ovulation.
Stage 4 Luteal Phase Shown In The Menstrual Cycle Diagram
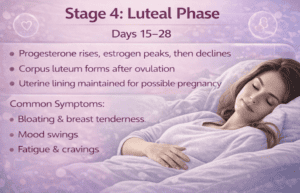
The luteal phase begins immediately after ovulation. In diagrams, the follicle transforms into the corpus luteum. This structure releases progesterone. Progesterone stabilises the uterine lining.
Diagrams show progesterone dominating this stage. If pregnancy occurs, hormone levels remain high. If not, hormone levels fall gradually. This fall triggers the next menstruation.
Many women experience premenstrual symptoms now. These include bloating, mood changes, or fatigue. Diagrams explain why these symptoms occur. Hormonal shifts affect the nervous system.
Understanding this stage helps manage expectations. Lifestyle adjustments reduce discomfort. For symptom support, explore this premenstrual care guide on Menstrual Cycle.
You can also read from the cycle aligned lifestyle category for practical tips.
Progesterone Changes Explained Visually
Progesterone rises steadily after ovulation. It maintains uterine lining thickness. Body temperature increases slightly. Hormones decline toward cycle end. Menstruation begins next.
Common Body Responses After Ovulation
Fatigue may increase gradually. Appetite may rise slightly. Emotional sensitivity can appear. Sleep patterns may change. Awareness supports better self care.
Read More-The 4 Phases of The Menstrual Cycle in Order: A Complete Guide
Why Menstrual Cycle Diagrams Help Track Health
Diagrams help women recognise normal patterns. They support early detection of irregular cycles. Tracking diagrams improves communication with healthcare providers. Visual tools make cycle education easier. Consistent tracking builds long-term awareness.
For practical tracking tools, refer to this menstrual cycle tracking resource on Menstrual Cycle.
You can also explore the cycle education category for printable guides and planners.
Conclusion
A menstrual cycle stages diagram explains monthly body changes clearly. Visual learning connects symptoms with hormonal activity. Understanding the stages of the menstrual cycle diagram builds confidence and awareness. A menstruation period diagram shows that each phase serves a purpose. To explore more reliable menstrual health resources, visit the Menstrual Cycle homepage and continue learning today.
FAQs
What Is A Menstrual Cycle Stages Diagram?
A menstrual cycle stages diagram visually explains hormonal and physical changes during the cycle. It shows how ovaries and uterus respond monthly. Diagrams simplify complex processes. They support better understanding of symptoms. Many women use diagrams for tracking.
How Accurate Are Menstrual Cycle Diagrams?
Diagrams represent average cycles. Individual cycles may vary slightly. Hormonal timing differs among women. Diagrams still provide helpful guidance. Tracking personal patterns improves accuracy.
What Does A Menstruation Period Diagram Show?
It shows uterine lining shedding. Hormone levels appear low. Bleeding duration is illustrated. The uterus resets for a new cycle. This stage starts the cycle.
Why Is Ovulation Important In Diagrams?
Ovulation marks the fertile window. Diagrams show hormone surges clearly. Egg release timing becomes visible. This helps family planning decisions. Awareness improves reproductive health.
Can Diagrams Help With Irregular Periods?
Yes diagrams help identify pattern changes. Irregular timing becomes noticeable. Tracking highlights hormonal shifts. This supports early medical consultation. Awareness improves management.
Should Teenagers Learn Using Menstrual Diagrams?
Yes diagrams simplify learning. Visual tools reduce fear and confusion. Early education builds confidence. It promotes healthy habits. Knowledge supports lifelong awareness.